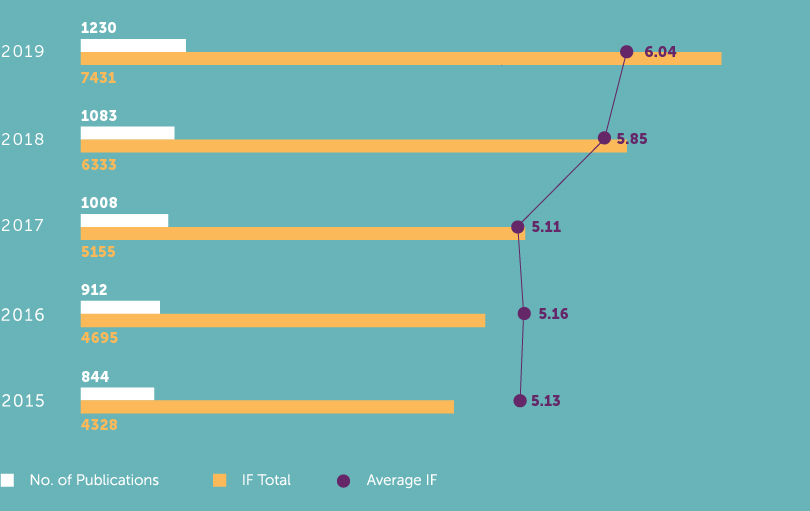
Evolution in the last 5 years
Publications by type
| No. of Publications | TOTAL IF | AVERAGE IF | |
|---|---|---|---|
| Articles | 1069 | 6224 | 5.82 |
| Reviews | 102 | 772 | 7.57 |
| Editorials | 47 | 351 | 7.47 |
| Scientific Letters | 12 | 83 | 6.93 |
| Total* | 1230 | 7431 | 6.04 |
| *Clinical Trials | 82 | 1301 | 15.87 |
| *Clinical Guidelines | 30 | 90 | 3.01 |
Distribution of publications per quartiles and first deciles
| No. of Publications |
% | % of 1st quart | |
|---|---|---|---|
| Q1 | 682 | 55.4% | |
| Q2 | 301 | 24.5% | |
| Q3+Q4 | 247 | 20.1% | |
| TOTAL | 1230 | ||
| D1 | 320 | 26.0% | 46.9% |
Publications by areas & Groups
| No. of Publications | %Q1 | TOTAL IF | AVERAGE IF | |
|---|---|---|---|---|
| VHIR | 1230 | 55.4% | 7431 | 6.04 |
| AREAS | ||||
| Oncology | 141 | 52.5% | 748 | 5.30 |
| Biomedical Research in Gynecology | 30 | 53.3% | 135 | 4.51 |
| Biomedical Research in Urology | 20 | 20.0% | 53 | 2.63 |
| Translational Molecular Pathology | 43 | 65.1% | 250 | 5.81 |
| Biomedical Research in Cancer Stem Cells | 4 | 50.0% | 16 | 4.01 |
| Translational Research in Child and Adolescent Cancer | 27 | 55.6% | 200 | 7.39 |
| Animal models and cancer laboratory, Melanoma program | 5 | 40.0% | 19 | 3.87 |
| CIBBIM – Nanomedicine. Biomedical Research in Digestive Tract Tumors | 7 | 71.4% | 51 | 7.25 |
| CIBBIM – Nanomedicine. Drug Delivery and Targeting | 8 | 62.5% | 44 | 5.49 |
| CIBBIM – Nanomedicine. Diagnostic Nanotools (DINA) | 3 | 100.0% | 13 | 4.21 |
| Vascular Biology and Metabolism (VAM) | 248 | 62.9% | 1470 | 5.93 |
| Cardiovascular Diseases | 104 | 68.3% | 803 | 7.72 |
| Diabetes and Metabolism | 35 | 65.7% | 179 | 5.12 |
| Nephrology | 25 | 56.0% | 94 | 3.74 |
| Neurovascular Diseases | 32 | 78.1% | 210 | 6.55 |
| CIBBIM – Nanomedicine. Kidney physiopathology | 31 | 67.7% | 123 | 3.97 |
| Ophthalmology | 12 | 25.0% | 33 | 2.79 |
| Molecular Medical Imaging | 18 | 61.1% | 87 | 4.82 |
| Research on Aging, Frailty and Transitions in Barcelona | 7 | 28.6% | 22 | 3.12 |
| Neurosciences | 276 | 65.9% | 1952 | 7.07 |
| Neuromuscular and Mitochondrial Pathology | 10 | 80.0% | 55 | 5.46 |
| Psychiatry, Mental Health and Addictions | 42 | 59.5% | 236 | 5.61 |
| Pediatric Neurology | 33 | 57.6% | 153 | 4.62 |
| Clinical Neuroimmunology | 45 | 71.1% | 462 | 10.26 |
| Neurotraumatology and neurosurgery research group (UNINN) | 40 | 57.5% | 278 | 6.96 |
| Neurodegenerative Diseases | 10 | 90.0% | 68 | 6.77 |
| Cell Signaling and Apoptosis | 2 | 100.0% | 10 | 4.79 |
| Headache and Neurological Pain | 13 | 76.9% | 106 | 8.12 |
| Peripheral Nervous System | 10 | 40.0% | 39 | 3.94 |
| Clinical and Translational Bioinformatics | 7 | 85.7% | 39 | 5.60 |
| Gene Therapy at Nervous System | 1 | 100.0% | 5 | 4.54 |
| Stroke Research | 46 | 76.1% | 383 | 8.32 |
| Neuroradiology | 23 | 65.2% | 160 | 6.94 |
| Epilepsy Group | 17 | 17.6% | 49 | 2.86 |
| Infectious Diseases | 260 | 43.5% | 1322 | 5.08 |
| Infectious Diseases | 106 | 41.5% | 474 | 4.47 |
| Microbiology | 89 | 34.8% | 314 | 3.53 |
| Clinical Research/Innovation in Pneumonia & Sepsis (CRIPS) | 38 | 42.1% | 204 | 5.38 |
| Shock, Organ Dysfunction and Resuscitation | 30 | 56.7% | 283 | 9.44 |
| Infection in Immunocompromised Pediatric Patients | 34 | 26.5% | 122 | 3.59 |
| Epidemiology and Public Health | 18 | 33.3% | 111 | 6.17 |
| CIBBIM – Nanomedicine. Design and pharmacodynamics of nanoparticles | 11 | 81.8% | 61 | 5.53 |
| Digestive and Liver Diseases | 106 | 62.3% | 814 | 7.68 |
| Liver Diseases | 56 | 67.9% | 608 | 10.86 |
| Physiology and Pathophysiology of the Digestive Tract | 32 | 62.5% | 154 | 4.82 |
| Multidisciplinary Nursing Research Group | 7 | 42.9% | 11 | 1.62 |
| Immunomediated Diseases and Innovative Therapies | 229 | 51.5% | 1430 | 6.25 |
| Pneumology | 71 | 52.1% | 495 | 6.97 |
| Systemic Diseases | 68 | 47.1% | 403 | 5.93 |
| Diagnostic Immunology | 17 | 52.9% | 97 | 5.68 |
| Clinical Pharmacology | 12 | 66.7% | 73 | 6.08 |
| Gene and Cell Therapy | 1 | 100.0% | 31 | 30.64 |
| Transfusional Medicine. | 21 | 57.1% | 108 | 5.16 |
| Rheumatology | 31 | 45.2% | 204 | 6.58 |
| Clinical Biochemistry | 20 | 45.0% | 88 | 4.40 |
| Research in Surgery | 93 | 46.2% | 360 | 3.87 |
| CIBBIM-Nanomedicine. New Technologies and Craniofacial Microsurgery | 2 | 0.0% | 3 | 1.62 |
| Spine Research Unit | 16 | 50.0% | 46 | 2.90 |
| General Surgery | 44 | 40.9% | 141 | 3.20 |
| Reconstructive Surgery of the Locomotor System | 14 | 35.7% | 104 | 7.40 |
| Musculoskeletal Tissue Engineering | 15 | 93.3% | 69 | 4.61 |
| Emerging Research Group of Physical Medicine and Rehabilitation | 7 | 28.6% | 15 | 2.09 |
| Obstetrics, Pediatrics and Genetics | 91 | 38.5% | 328 | 3.60 |
| Maternal Fetal Medicine | 43 | 27.9% | 129 | 2.99 |
| Genetics Medicine | 22 | 50.0% | 98 | 4.47 |
| Growth and Development | 23 | 56.5% | 107 | 4.64 |
| CIBBIM – Nanomedicine. Bioengineering, Cell therapy and Surgery in Congenital Malformations | 11 | 36.4% | 28 | 2.57 |
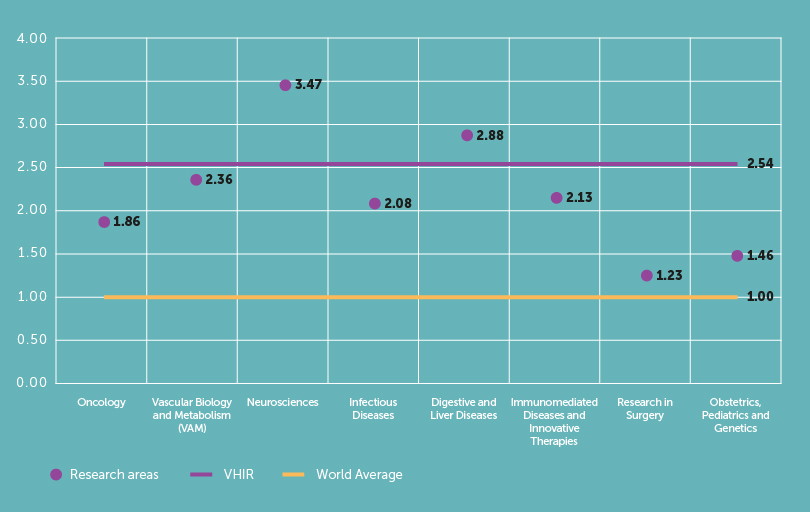
Normalized Impact & Excellence by areas
Crown Index 2015-2019
Highly Cited Papers 10% (HCP10%) 2015-2019
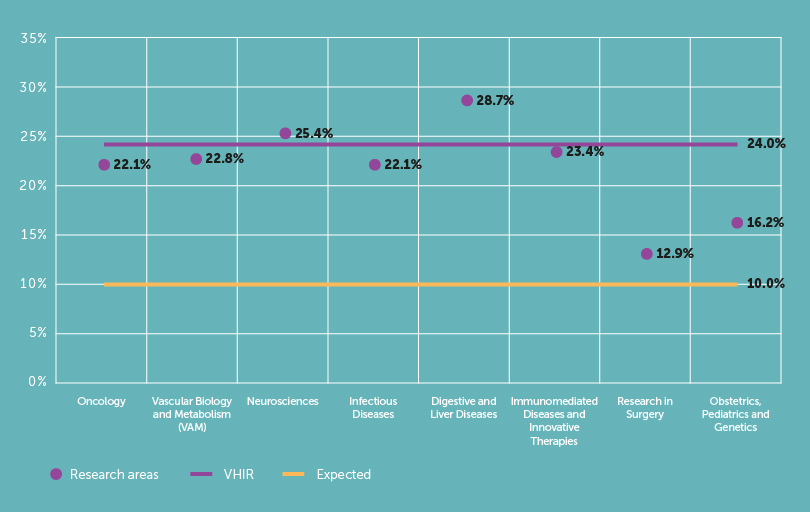
Leadership by areas
| %Leadership | %Q1 in leadership | %Female in leadership | |
|---|---|---|---|
| VHIR | 40.2% | 51.5% | 42.6% |
| AREAS | |||
| Oncology | 34.0% | 29.2% | 44.4% |
| Vascular Biology and Metabolism (VAM) | 42.3% | 61.0% | 32.5% |
| Neurosciences | 31.9% | 65.9% | 46.3% |
| Infectious Diseases | 40.0% | 35.6% | 39.8% |
| Digestive and Liver Diseases | 25.5% | 66.7% | 70.3% |
| Immunomediated Diseases and Innovative Therapies | 30.1% | 53.6% | 44.8% |
| Research in Surgery | 32.3% | 53.3% | 31.4% |
| Obstetrics, Pediatrics and Genetics | 28.6% | 38.5% | 63.2% |
International collaborations
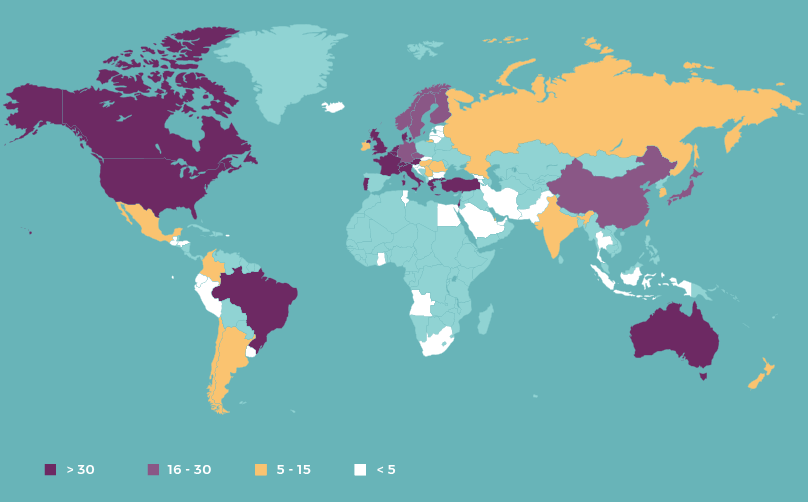
| Africa | 11 |
|---|---|
| Angola | 2 |
| Egypt | 2 |
| Ghana | 1 |
| South Africa | 3 |
| Tunisia | 3 |
| America | 578 |
| Argentina | 12 |
| Brazil | 33 |
| Canada | 108 |
| Colombia | 10 |
| Mexico/td> | 11 |
| Puerto Rico | 1 |
| Uruguay | 4 |
| USA | 380 |
| Chile | 13 |
| Honduras | 1 |
| Perú | 3 |
| Guatemala | 1 |
| Ecuador | 1 |
| Asia | 143 |
| Saudi Arabia | 3 |
| South Corea | 5 |
| United Arab Emirates | 1 |
| Hong-Kong | 2 |
| India | 15 |
| Iran | 2 |
| Israel | 47 |
| Japan | 18 |
| Pakistan | 1 |
| Qatar | 6 |
| Singapore | 15 |
| Taiwan | 5 |
| Xina | 23 |
| Europe | 1461 |
| Germany | 217 |
| Austria | 33 |
| Belgium | 55 |
| Bulgaria | 4 |
| Croatia | 4 |
| Denmark | 48 |
| Slovenia | 3 |
| Finland | 17 |
| France | 215 |
| United Kingdom | 222 |
| Greece | 37 |
| Netherlands | 71 |
| Hungary | 11 |
| Ireland | 10 |
| Italy | 228 |
| Latvia | 2 |
| Lithuania | 2 |
| Luxembourg | 1 |
| Malta | 1 |
| Norway | 22 |
| Poland | 23 |
| Portugal | 37 |
| Romania | 14 |
| Serbia and Montenegro | 9 |
| Sweden | 22 |
| Switzerland | 74 |
| Slovakia | 1 |
| Iceland | 1 |
| Macedonia | 2 |
| Estonia | 3 |
| Russia | 15 |
| Georgia | 2 |
| Turkey | 35 |
| Armenia | 1 |
| Czech Republic | 19 |
| Oceania | 64 |
| Australia | 58 |
| New Zealand | 5 |
| Indonesia | 1 |
International collaboration by areas
| % Int. Collaboration | |
|---|---|
| VHIR | 48.0% |
| AREAS | |
| Oncology | 32.6% |
| Vascular Biology and Metabolism (VAM) | 38.7% |
| Neurosciences | 61.2% |
| Infectious Diseases | 38.5% |
| Digestive and Liver Diseases | 48.1% |
| Immunomediated Diseases and Innovative Therapies | 42.4% |
| Research in Surgery | 48.4% |
| Obstetrics, Pediatrics and Genetics | 41.8% |
Open access
Open Access by areas
| % Open Access | |
|---|---|
| VHIR | 45.9% |
| AREAS | |
| Oncology | 46.8% |
| Vascular Biology and Metabolism (VAM) | 43.1% |
| Neurosciences | 51.1% |
| Infectious Diseases | 43.8% |
| Digestive and Liver Diseases | 50.9% |
| Immunomediated Diseases and Innovative Therapies | 45.9% |
| Research in Surgery | 29.0% |
| Obstetrics, Pediatrics and Genetics | 48.4% |
Publications in high influence journals
| Journal | No. of Publications | Journal’s Impact Factor (JCR 2018) |
|---|---|---|
| NEW ENGLAND JOURNAL OF MEDICINE | 4 | 70.670 |
| LANCET | 6 | 59.102 |
| JAMA-JOURNAL OF THE AMERICAN MEDICAL ASSOCIATION | 3 | 51.273 |
| NATURE | 2 | 43.070 |
| SCIENCE | 1 | 41.037 |
| LANCET ONCOLOGY | 1 | 35.386 |
| NATURE MEDICINE | 1 | 30.641 |
| LANCET NEUROLOGY | 8 | 28.755 |
| JOURNAL OF CLINICAL ONCOLOGY | 2 | 28.245 |
| LANCET INFECTIOUS DISEASES | 1 | 27.516 |
| NATURE GENETICS | 5 | 25.455 |
| Nature Reviews Endocrinology | 1 | 24.646 |
| Lancet Diabetes & Endocrinology | 1 | 24.540 |
| CANCER CELL | 1 | 23.916 |
| Nature Reviews Gastroenterology & Hepatology | 1 | 23.570 |
| EUROPEAN HEART JOURNAL | 7 | 23.239 |
| CIRCULATION | 5 | 23.054 |
| Nature Reviews Neurology | 2 | 21.155 |
| Nature Reviews Nephrology | 1 | 19.684 |
| ANNALS OF INTERNAL MEDICINE | 1 | 19.315 |
| GASTROENTEROLOGY | 7 | 19.233 |
| INTENSIVE CARE MEDICINE | 9 | 18.967 |
| JOURNAL OF HEPATOLOGY | 6 | 18.946 |
| JOURNAL OF THE AMERICAN COLLEGE OF CARDIOLOGY | 6 | 18.639 |
| GUT | 1 | 17.943 |
| TRENDS IN CELL BIOLOGY | 1 | 16.588 |
| BLOOD | 1 | 16.562 |
| AMERICAN JOURNAL OF RESPIRATORY AND CRITICAL CARE MEDICINE | 3 | 16.494 |
| JAMA Psychiatry | 1 | 15.916 |
| Lancet Global Health | 1 | 15.873 |
| CIRCULATION RESEARCH | 1 | 15.862 |
| Advanced Science | 1 | 15.804 |
| DIABETES CARE | 1 | 15.270 |
Methodology and Definitions
Indicators take into account articles, reviews, editorials and scientific letters published in journals indexed in Clarivate’s JCR 2018 (Journal Citation Reports).
No ahead of print publications are taken into account.
CROWN indicator shows the relative number of citations to publications, compared to the global average of citations to publications of the same type, year of publication and thematic area, being 1 the baseline or world average.
HCP10% (Highly Cited Papers 10%) shows the publications included in 10% of the world’s most cited publications of the same type, year of publication and subject area, being 10% the expected value (higher is better).
CROWN and HCP10% take into account articles and reviews from 2015 to 2019, and are calculated using Clarivate’s ESI (Essential Science indicators) baseline citation rates and baseline percentiles from its 14/05/2020 update.
Citations to calculate the CROWN and HCP10% indicators were downloaded from Clarivate WoS (Web of Science) on 16/05/2020. Citation count is not fractional.
Leadership indicators take into account first, last and/or corresponding author
Open Access takes into account green, gold and hybrid route publications, according to the Unpaywall database.